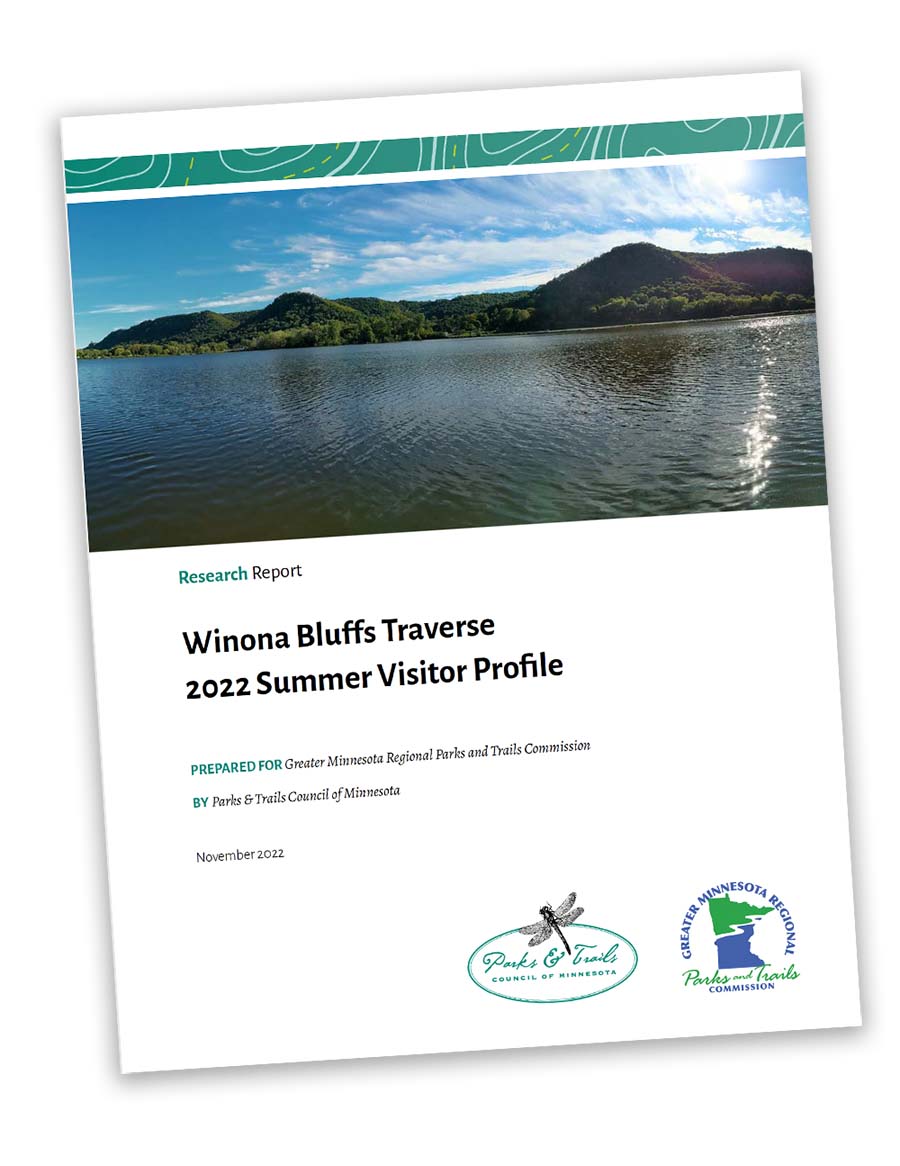
2022 Summer Visitor Profile: Winona Bluffs Traverse
Published November 2022
Key Findings
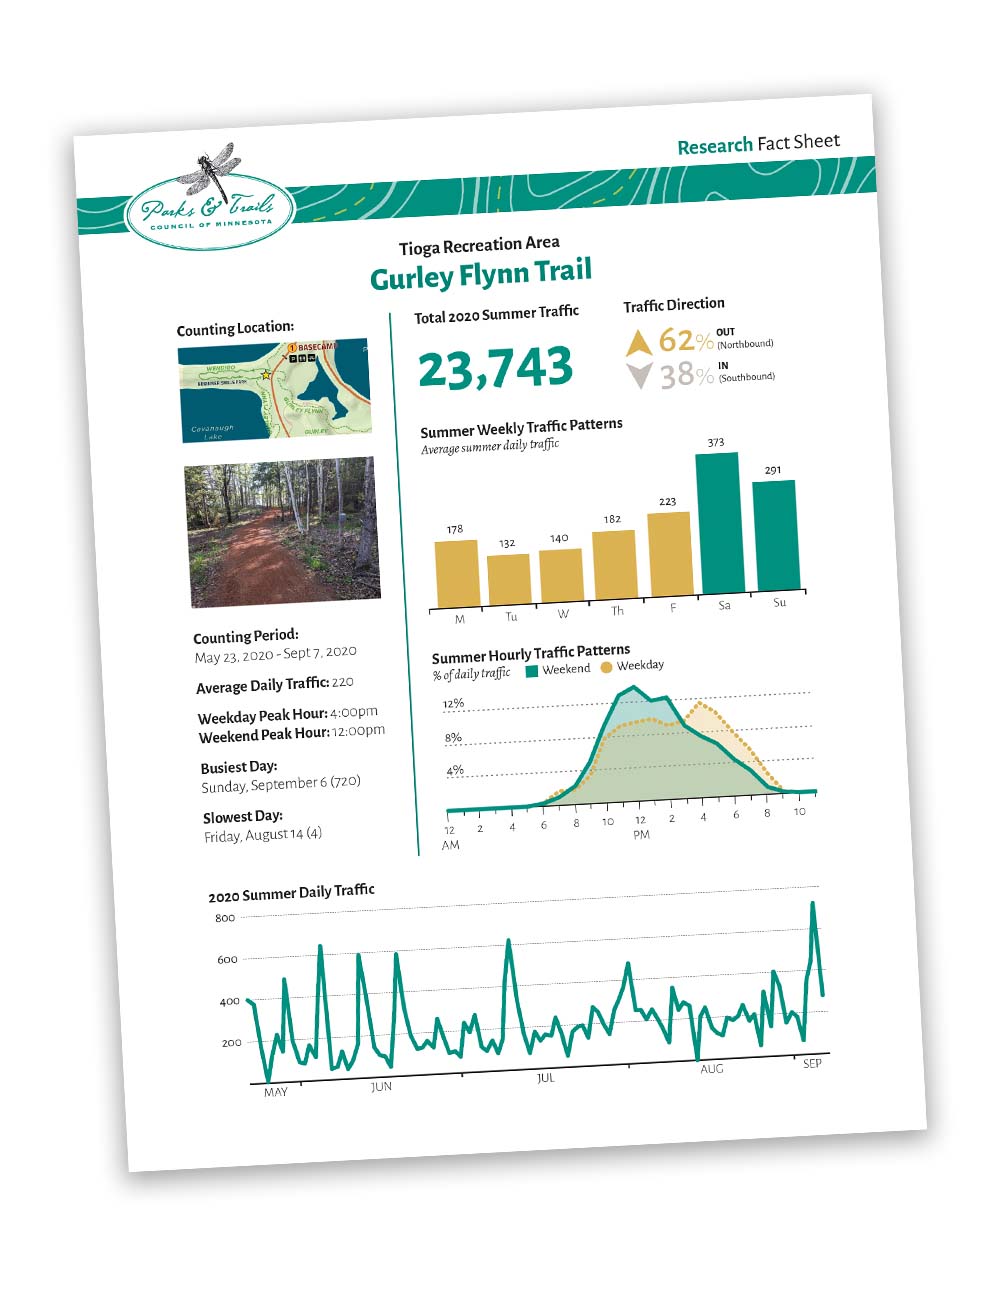
- Trail Traffic Estimates
- About 3,500to 39,000 depending on location
- 54% of use at Garvin Heights
- 54% of use at Sugar Loaf
- 31% of use at Bluffside Park
- Trail use peaks around 3 pm on weekends and 6 pm on weekdays
- Visitor Demographics
- 51% Women
- 48% Men
- Average age of 37
- 90% White
- 5% Asian
- 4% Hispanic
- 2% Black
- Trail Experience – Garvin Heights
- 73% Primary activity is hiking on foot path
- 13% Primary activity is jogging on foot path
- 48% Rated the foot path “very good”
- 79% Visit the overlook to experience nature or tak in scenic views
- Trail Experience – Sugar Loaf
- 84% Primary activity is hiking
- 7% Primary activity is rock climbing
- 75% Rated the trail “very good”
- 61% Visit to spend time with family/friends
- Trail Experience – Bluffside Park
- 53% Primary activity is hiking
- 26% Primary activity is mountain biking
- 56% Rated the trail “very good”
- 74% Visit to experience nature
- Trail Tourism
- 74% from Minnesota
- Users came from 21 states and 2 countries
- Information Sources
- 46% have known about the trail for years
- 41% heard about the trail from family and friends
- 18% used the internet to learn about the trails
